
A >99% HPLC purity result means the target peptide accounts for more than 99% of the total integrated peak area detected under the stated test conditions. In practical terms, that is what >99% peptide purity means: a high proportion of the detected, UV-absorbing material is attributed to the target peptide. The result alone doesn’t confirm identity, sterility, potency, or how much peptide is present by total sample weight.
A high percentage can look definitive, but its meaning depends on what the test measured and what the certificate of analysis documents. HPLC peak area is useful evidence of chromatographic purity, not a complete assessment of every quality attribute that may matter in research.
This article explains how HPLC separates sample components and calculates purity from peak areas, what to look for on a certificate of analysis, and how purity grades differ in research. You’ll also see why the appropriate grade depends on whether impurities could affect the result being measured.
Key Takeaways
- Read an HPLC purity result as a comparison of detected peak areas, not as a complete measure of peptide content or overall quality.
- Use the chromatogram and test conditions to understand what the reported purity percentage represents.
- Assess a certificate of analysis for batch-specific traceability and separate evidence of peptide identity.
- Choose a purity grade based on whether impurities could affect the research assay or its interpretation.
How is peptide purity measured?
HPLC separates peptide components, then estimates the target’s share of detected material. The method and impurity profile matter when interpreting a purity percentage for research.
HPLC and UPLC Measurement
HPLC and UPLC separate sample components in a column before detection. A UV detector commonly measures peptide bonds at 214 nm; aromatic residues can also be detected across 220-280 nm. The resulting chromatogram helps quantify components. How is peptide purity measured by HPLC or UPLC? The target peak’s area is compared with the total detected peak area. This method provides a chromatographic estimate, not a complete sample analysis.
Variation Across Methods and Laboratories
Purity results can differ when laboratories use different detection wavelengths or chromatographic conditions. Column selection, solvent gradient, and peak integration can affect which components are detected and how their areas are calculated. Can HPLC purity results vary by method or laboratory? Yes. Comparisons are more meaningful when the method, wavelength, and integration approach are reported consistently. A certificate of analysis should identify the test conditions.
Identifying and Evaluating Impurities
Impurity evaluation identifies components beyond the target and considers their possible relevance to the research question. Peptide synthesis can produce byproducts, truncated sequences, and other sequence-related variants. Degradation products may also appear. These components can create separate chromatogram peaks, but a purity percentage alone doesn’t identify them or establish their toxicity or reactivity. Mass spectrometry can help confirm molecular identity, while the chromatogram shows detectable components under the selected method.
Interpret the impurity profile in the context of the assay. For example, an uncharacterized sequence variant could complicate results if it affects the measured response. Review the chromatogram alongside the certificate of analysis, including its test method and batch identification. The International Organization for Standardization names ISO 17025 as an example of an accreditation standard for testing. That accreditation reference concerns laboratory testing competence, not the peptide’s identity or purity result itself.
What to check on a certificate of analysis
A certificate of analysis (COA) is useful when its results are tied to the exact batch under review. Check that its unique lot or batch identifier matches the sample. Each peptide batch should have its own COA; a generic document doesn’t establish that the tested material came from that lot.
Review the analytical methods and results together. A COA should report HPLC purity data and mass spectrometry identity confirmation. HPLC reports a purity percentage based on detected peaks, while mass spectrometry compares the measured molecular weight with the expected weight for the peptide sequence. Neither result alone establishes biological activity.
- Match the lot identifier on the COA to the batch being evaluated.
- Look for HPLC purity data, mass spectrometry results, and the testing laboratory’s identity.
- Read the method details and any stated analytical detection limits.
Detection limits define what an analytical method can detect or quantify. A component below a method’s detection limit may not appear as a quantified result, so an undetected contaminant shouldn’t be treated as proof of absence. UV-based purity analysis also doesn’t detect salt counterions, residual solvents, or water. These components can affect peptide content by weight without changing the reported UV peak-area percentage.
Microbiological attributes require dedicated assays. Chemical analysis doesn’t detect sterility, endotoxins, microbial bioburden, or mycoplasma. These require separate tests. For research decisions, the COA should make clear which tests were performed and which laboratory produced the data.
How can buyers verify a peptide supplier’s purity claims? Compare the batch identifier, HPLC chromatogram and reported method with mass spectrometry identity data. Check laboratory transparency, and treat a claim of 99.9%+ purity as a potential red flag because that level is rare and difficult to achieve consistently.
For research focused on peptide quality, explore research peptide offerings alongside the evidence documented for each batch.
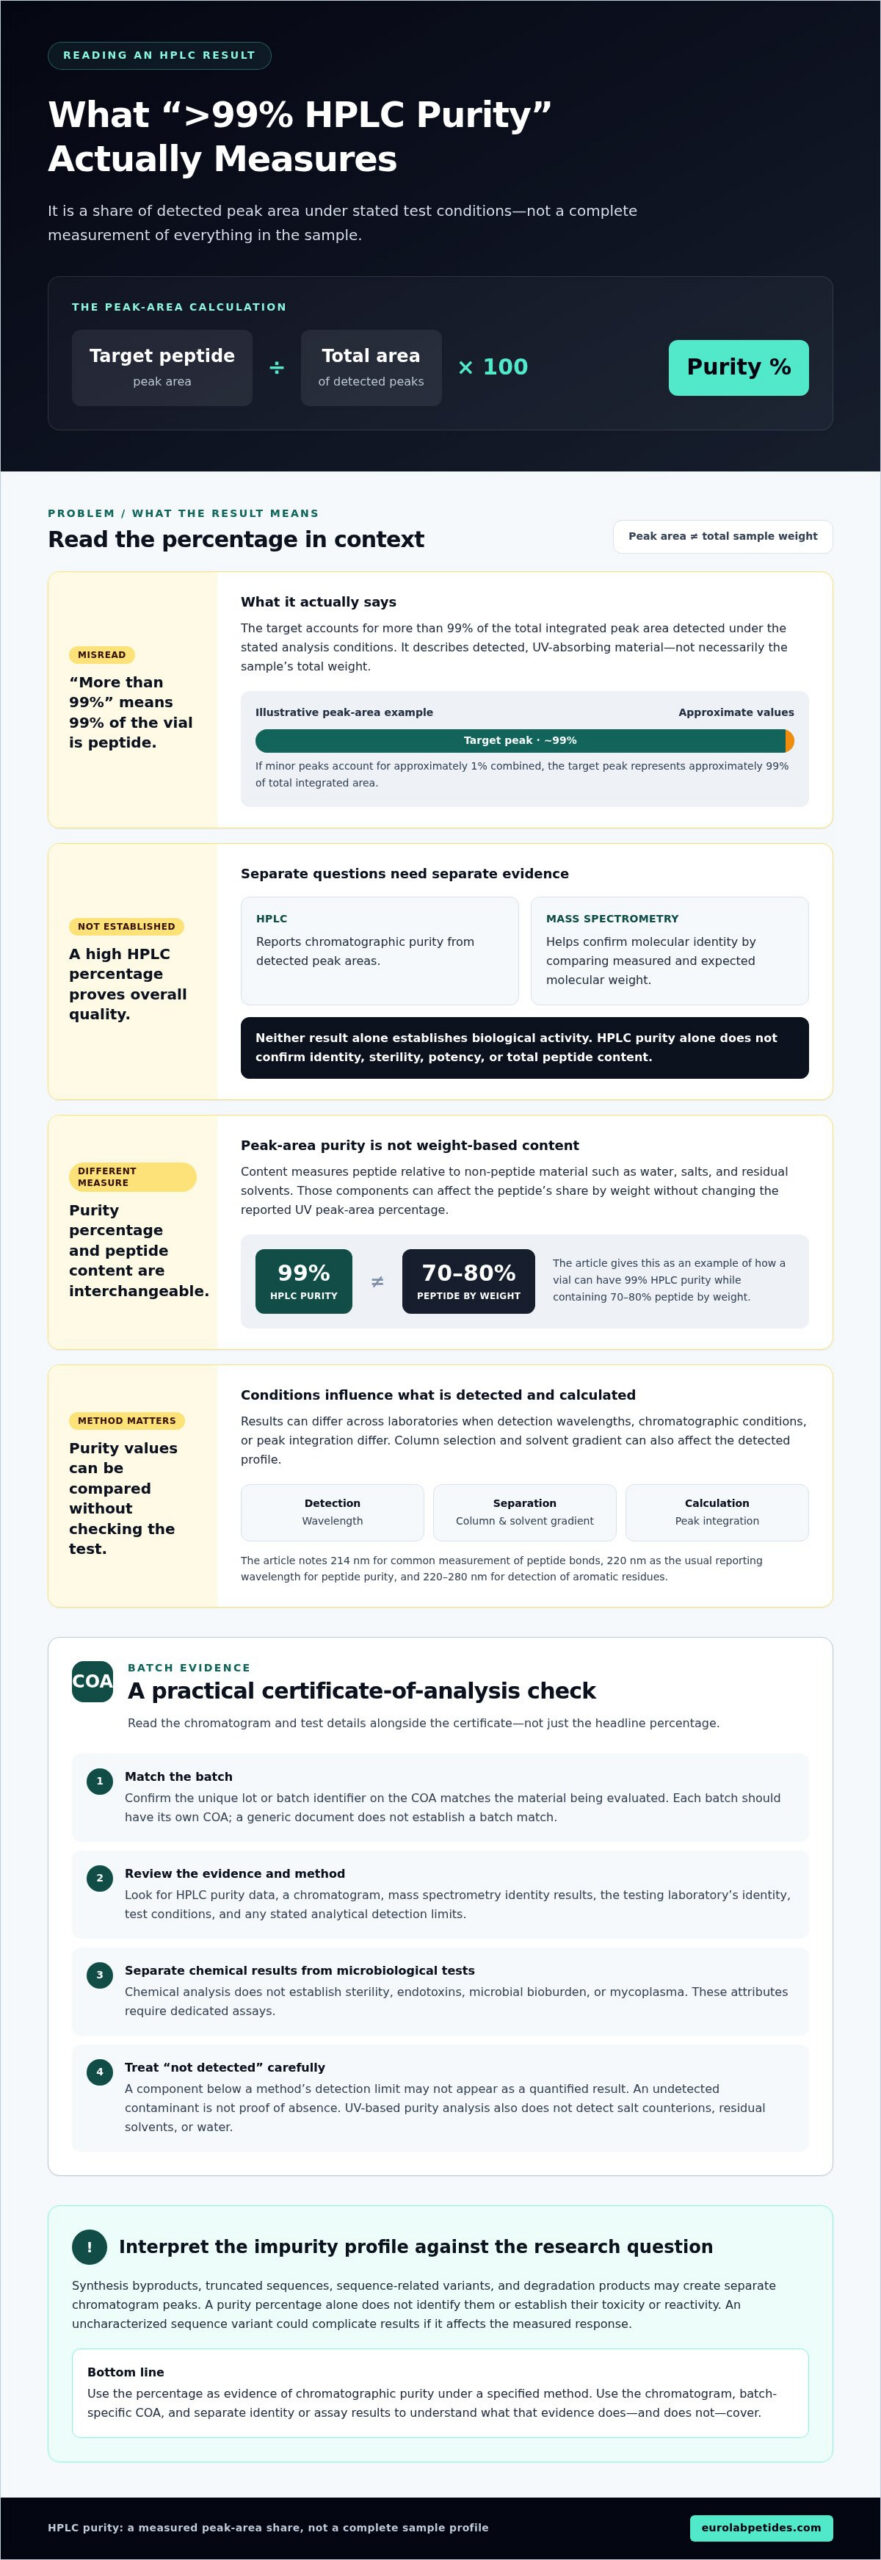
How HPLC calculates peptide purity from peak area
High-performance liquid chromatography separates sample components before detection. Its peak-area calculation reports the target peptide’s share of detected material.
HPLC Peak Areas and Chromatograms
A chromatogram plots detector response as components pass through a chromatography column. Each detectable component can appear as a peak, with its area representing relative quantity under the method used. A chromatogram can help researchers distinguish the target peptide peak from other detected components. A chromatogram lets researchers inspect the measured profile behind an HPLC purity result rather than relying on the percentage alone.
Calculating Purity from Peak Areas
HPLC purity is calculated by dividing the target peptide peak area by the total area of all detected peaks, then expressing the result as a percentage. For example, if minor peaks account for approximately 1% combined, the target peak represents approximately 99% of the total integrated area. A reported 99.4% result applies to the detected peaks under that analysis, not automatically to every substance in the sample. The usual reporting wavelength for peptide purity is 220 nm.
Purity Versus Peptide Content
HPLC purity and peptide content describe different properties. Purity compares detected target and impurity peaks; content measures peptide relative to non-peptide material, such as water, salts, and residual solvents. A vial can show 99% HPLC purity while containing only 70-80% peptide by weight. The remaining weight may include components that UV-based peak analysis doesn’t detect.
This distinction matters when interpreting the amount of target material in a sample. A high purity percentage doesn’t establish mass content, biological performance, or functional activity. Use the chromatogram to understand the peak calculation, then distinguish that result from other measurements of sample composition or identity. The analytical method defines which material contributes to the reported percentage.
Peptide purity grades
Purity grades describe the proportion of detected material attributed to the target peptide. They’re useful for comparison, not universal guarantees of suitability. A grade matters only alongside the assay, impurity profile, and batch documentation. For research decisions, consider whether detected impurities could affect the measured outcome rather than treating the label as a complete quality assessment.
Research-grade peptides are described as 70-85% pure, while high-purity grades span 85-95%. These ranges don’t determine one universal use. Screening assays may tolerate a different impurity profile than quantitative work. A sample below 95% warrants scrutiny: identify its impurities and consider whether they could alter the assay readout. Lower purity can also increase lot-to-lot variability, particularly below 80%.
Application requirements refine those comparisons. Purity of at least 75% may suit ELISA testing and peptide arrays. In-vitro bioassays commonly call for at least 85%, while quantitative studies may require at least 95%. Applications such as crystallography and structure-activity relationship studies may call for at least 98%. Treat these as context-specific thresholds, not interchangeable grades. The assay’s sensitivity to impurities is decisive.
For exploratory screening, 97-99% purity can be acceptable when small impurities are unlikely to confound the readout. A 95-97% sample is more conditional: its impurity profile should be characterized, with impurities known to be inert in that assay context. For research where impurities could confound results, a threshold of at least 99% may be appropriate. Even a 1% difference between 98% and 99% may matter differently across experimental designs.
Compare the stated grade with the COA’s batch results, chromatogram, and identity evidence. Mass spectrometry can support molecular identity, but it doesn’t replace HPLC purity data. Third-party testing adds an independent analytical record when available. For studies in weight management, explore Weight Management Research as a research area alongside the purity criteria relevant to your assay.
EuroLab Peptides: Longevity & Vitality Research
EuroLab Peptides supports research in longevity and vitality, weight management, tissue repair and recovery, and cognitive function. These research areas offer a starting point for considering how peptide quality evidence relates to a defined research focus. HPLC purity is one analytical measure; interpret it alongside batch documentation and the requirements of the planned research.
Start by identifying the research area and the quality attributes relevant to its experimental design. In longevity and vitality research, as in other fields, a purity percentage alone doesn’t establish identity, peptide content, or biological activity. Batch-specific analytical evidence helps put the result in context.
Contact EuroLab Peptides to discuss research areas relevant to your work.
Make purity part of the research plan
Before a study begins, define how sample quality will be handled in the experimental design. Set acceptance criteria that fit the assay, decide how deviations will be documented, and keep analytical records connected to the research question. This makes quality assessment a planned variable, not a last-minute interpretation.
Understanding what >99% peptide purity means is most useful when the reported result informs a specific research decision. A percentage alone can’t determine whether a sample suits every study. The relevant question is how the material’s documented characteristics align with the planned analysis and its controls. Clear criteria also make future comparisons more consistent across experiments.
For research focused on longevity and vitality, weight management, or tissue repair and recovery, connect the intended research area with the quality evidence relevant to your work. Contact EuroLab Peptides to discuss your research focus. A defined plan gives your next study a more rigorous starting point.
Frequently Asked Questions
What Does 99% Purity Really Mean?
A 99% HPLC result assigns 99% of the integrated detected peak area to the target peptide under the stated method. The percentage describes the analytical signal, not the whole vial’s weight. Understanding what >99% peptide purity means also requires knowing the test conditions: results from different methods aren’t directly comparable unless their analytical conditions align.
Can I trust a purity number without seeing the chromatogram?
A number without its chromatogram offers limited evidence for assessing the result. The trace lets you inspect detected peaks and their relative prominence, while the method details explain the conditions behind them. When reviewing a batch record, match its identifier to the material and check whether the reported test conditions suit the comparison you plan to make.
Does 99% purity guarantee quality?
No. A high HPLC result describes one analytical attribute, not every quality feature relevant to an experiment. For example, it doesn’t establish biological activity or prove that the sample’s handling history preserved its properties. Consider the intended assay and the evidence each quality question requires; separate analytical results address separate characteristics.
Is 99% Purity Considered High?
Yes, 99% is generally considered high in analytical testing contexts. Whether it fits a study depends on the assay’s sensitivity and the role of impurities in its readout. A screening experiment and a quantitative comparison can have different requirements. Evaluate the grade against the study’s acceptance criteria rather than treating the label as universally suitable.
What does a purity percentage not tell you?
A purity percentage doesn’t identify each impurity or establish its biological effect. It also doesn’t report total peptide content by weight, stability, or batch consistency. A sample’s analytical purity and measured mass content answer distinct questions. Keep those interpretations separate when evaluating experimental materials or comparing records from different batches.
What purity threshold should you accept?
Set the threshold according to assay sensitivity and whether impurities could confound the outcome. Understanding what >99% peptide purity means helps frame that decision, but the number alone can’t define suitability. For example, determine whether the study needs exploratory screening or precise quantitative comparisons, then assess the impurity information and documentation against that purpose.
