

A single incorrect assignment of a y-ion fragment can invalidate months of rigorous synthesis and sequence verification. Many researchers find that the transition from raw spectral output to a verified Certificate of Analysis is hindered by the inherent complexity of fragmentation nomenclature and the subtle differences between monoisotopic and average mass. This technical guide provides the methodology required for interpreting mass spectrometry data for peptides, ensuring that you can confirm sequence fidelity and identify common synthesis byproducts with absolute precision.
You’ll gain the analytical framework to correlate observed m/z values with theoretical backbone fragmentation, allowing for the confident verification of peptide identity in a laboratory setting. We detail the integration of current software standards, including Proteome Discoverer 3.3 and MaxQuant 3.0.3, while addressing the critical shift in the UniProt Knowledgebase 2026_01 release. This progression from raw data to empirical validation establishes a standardized approach to quality assurance for high-stakes research applications. By mastering these fundamental principles, you ensure that every peptide batch meets the rigorous technical specifications required for elite professional inquiry.
Key Takeaways
- Differentiate between monoisotopic mass and average molecular weight to ensure the precise identification of precursor ions during initial spectral screening.
- Utilize Roepstorff-Fohlman nomenclature to systematically map b and y ion fragments for comprehensive primary structure validation.
- Master the technical workflow for interpreting mass spectrometry data for peptides to confirm sequence accuracy through methodical backbone cleavage analysis.
- Identify specific synthesis byproducts, including deletion sequences and residual protecting groups, to verify the chemical integrity of laboratory batches.
- Align experimental results with the technical specifications on a Certificate of Analysis to transition from raw data to objective product verification.
Fundamentals of Peptide Mass Spectrometry
Mass spectrometry (MS) is an analytical technique that measures the mass-to-charge ratio (m/z) of gas-phase ions to determine the molecular weight and chemical structure of a sample. In the context of biochemical research, it serves as the primary methodology for verifying the identity and purity of synthetic sequences. By converting peptide molecules into charged species, researchers can utilize electromagnetic fields to manipulate their trajectory, allowing for the precise measurement of their physical properties. High-resolution mass spectrometry (HRMS) remains the gold standard for research verification because it provides the mass accuracy required to distinguish between peptides with identical nominal masses but different elemental compositions.
The process of interpreting mass spectrometry data for peptides begins with understanding how these molecules are ionized. Soft ionization techniques, such as Electrospray Ionization (ESI) and Matrix-Assisted Laser Desorption/Ionization (MALDI), are utilized to prevent the premature degradation of the peptide backbone. These methods are foundational to the broader field of protein mass spectrometry, where the preservation of the intact molecular ion is critical for downstream analysis.
The Role of Ionization in Peptide Analysis
Ionization is typically achieved through protonation in positive mode MS, where protons are sequestered by basic amino acid residues such as lysine, arginine, or histidine, as well as the N-terminus. This often results in the formation of multiply charged ions, denoted as [M+nH]n+. The presence of multiple charges is advantageous; it reduces the m/z value of larger peptides, bringing them within the optimal detection range of most mass analyzers. However, solvent conditions play a decisive role in this process. Trifluoroacetic acid (TFA), while common in peptide synthesis, can cause significant ion suppression. Researchers must optimize mobile phase additives, often substituting TFA with formic acid, to improve signal-to-noise ratios and ensure the detection of low-abundance impurities.
MS1 vs. MS2: Identity vs. Structure
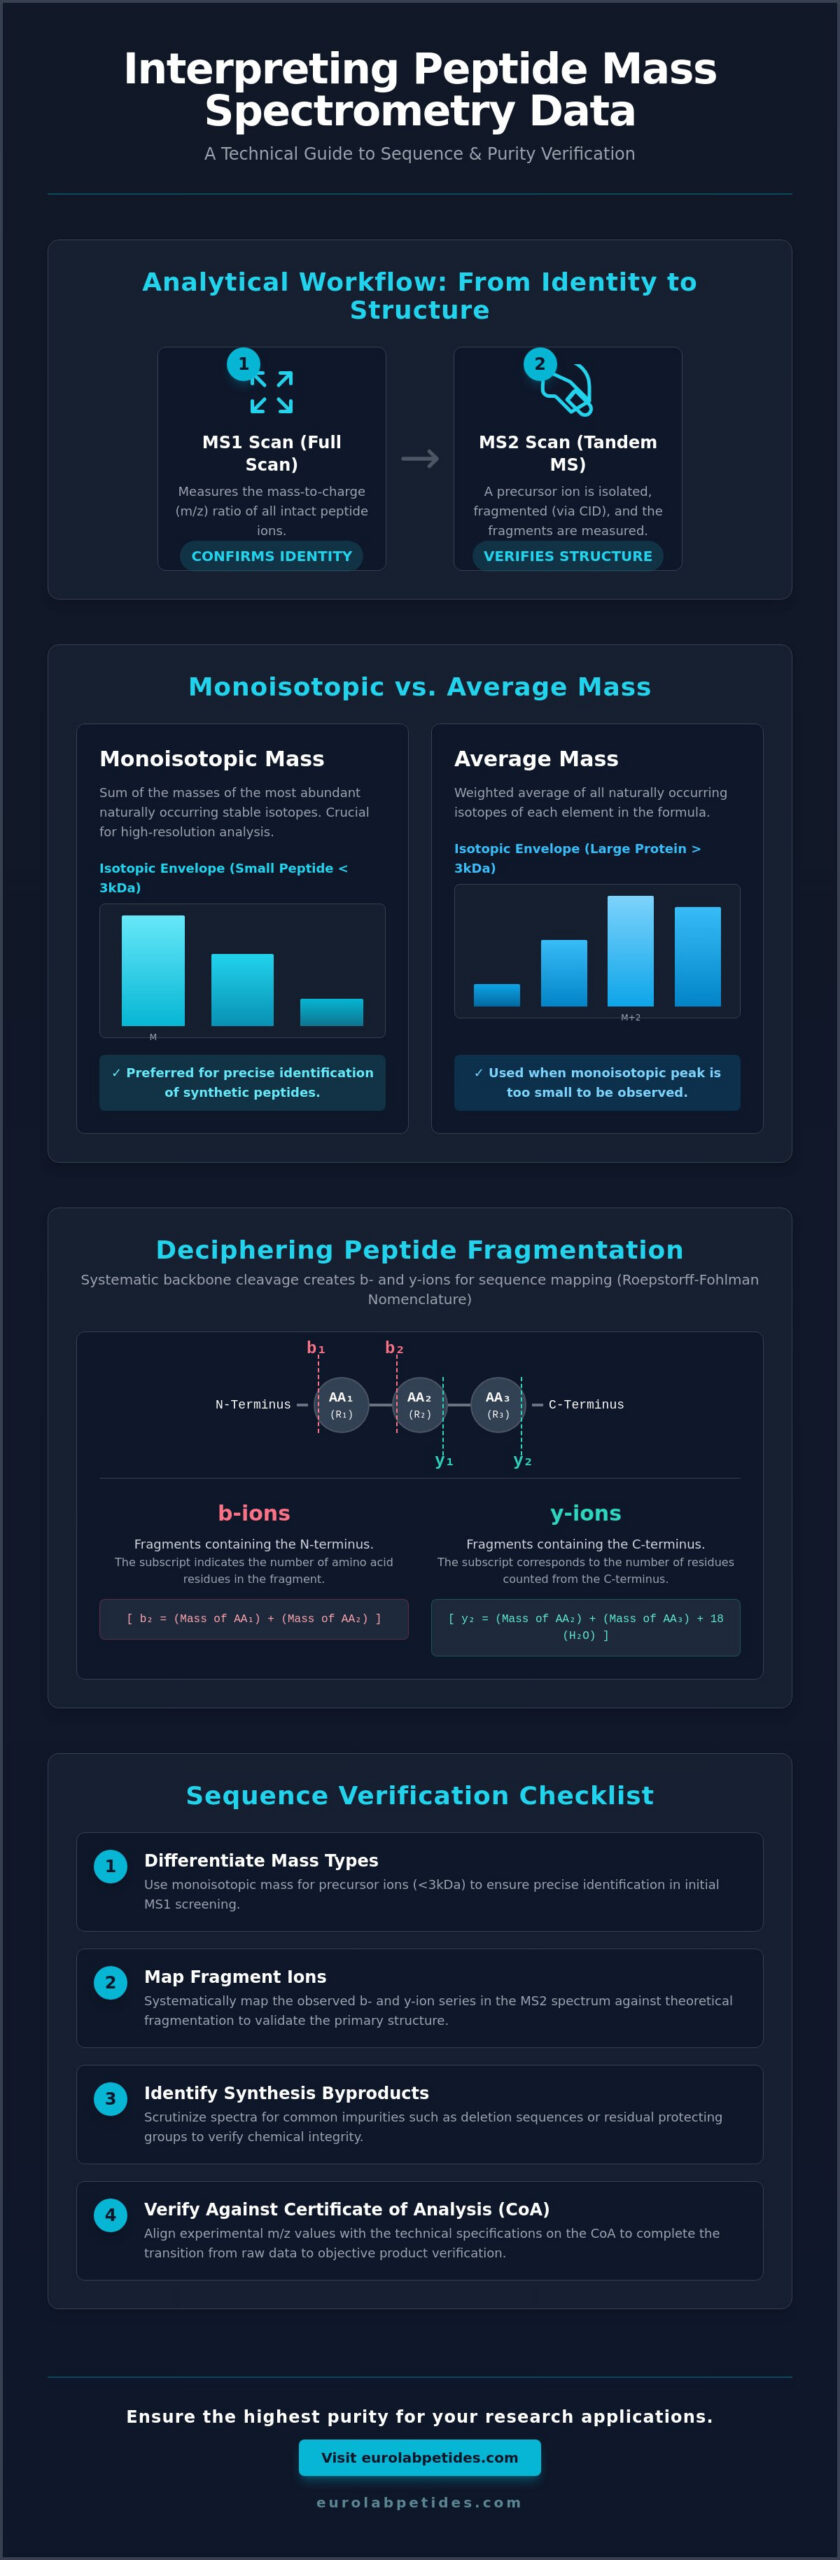
Analytical workflows are divided into two distinct stages: MS1 and MS2. An MS1 scan, or full scan, records the m/z values of all intact ions entering the detector. This data is used to determine the intact molecular mass of the peptide, providing an initial confirmation of the target sequence. While MS1 confirms identity, it cannot verify the internal sequence. For this, MS2 (tandem MS) is required. During MS2, a specific precursor ion is isolated and subjected to Collision-Induced Dissociation (CID). The resulting fragment ions provide a map of the peptide backbone. Precise precursor ion selection is essential in targeted research to avoid the co-fragmentation of synthesis byproducts, which can lead to ambiguous spectral interpretation.
Interpreting the m/z Ratio and Isotopic Distributions
Accurate interpreting mass spectrometry data for peptides necessitates a precise calculation of the theoretical mass based on amino acid composition. Every residue contributes a specific monoisotopic mass to the total molecular weight. While nominal mass provides a rough estimate, high-resolution analysis requires the use of exact isotopic masses. The observed mass-to-charge ratio (m/z) is not merely a single data point but a distribution of peaks known as the isotopic envelope. This distribution arises from the natural occurrence of heavy isotopes, primarily Carbon-13 (13C), which exists at an abundance of approximately 1.1%. In a standard practical workflow for peptide identification, the first peak in this envelope, the monoisotopic peak, is the most critical metric for sequence verification.
Monoisotopic vs. Average Mass
Monoisotopic mass is defined as the sum of the masses of the most abundant isotopes for each element in the peptide. For molecules under 3000 Da, this peak is typically the most intense and provides the highest degree of confidence in mass assignment. Average molecular weight, conversely, is the weighted average of all naturally occurring isotopes. As peptide size increases, the probability of a molecule containing at least one 13C atom rises. In larger proteins, the monoisotopic peak may become undetectable, necessitating a shift toward average mass or the use of deconvolution algorithms to determine the zero-charge molecular weight. For researchers focused on Longevity & Vitality Research, ensuring the correct mass assignment is a non-negotiable step in verifying the integrity of synthetic compounds.
Analyzing Charge States and Adducts
Determining the charge state (z) is a mathematical prerequisite for calculating the actual mass (M) from the observed m/z. The distance between isotopic peaks within an envelope is inversely proportional to the charge. If the peaks are separated by 1.003 Da, the peptide is singly charged ([M+H]+). A spacing of 0.5 Da indicates a doubly charged state ([M+2H]2+), while 0.33 Da signifies a triply charged species. This rhythmic spacing is a reliable benchmark for spectral validation.
Raw data often contains signals from non-proton adducts that can complicate interpretation. Sodium ([M+Na]+) and potassium ([M+K]+) adducts appear as distinct mass shifts of +22.989 Da and +38.963 Da, respectively. These are not impurities in the peptide sequence but artifacts of the ionization process or buffer components. Distinguishing these adducts from true sequence modifications is essential for maintaining the high-stakes precision required in biochemical analysis. Artifacts such as electronic noise or solvent clusters are identified by their lack of a logical isotopic distribution, allowing for their exclusion during data refinement during the process of interpreting mass spectrometry data for peptides.
Deciphering Peptide Fragmentation: b and y Ions
The transition from intact mass verification to structural elucidation requires a methodical analysis of fragment ions. Roepstorff-Fohlman nomenclature serves as the universal standard for identifying these fragments, which are generated when the peptide backbone undergoes cleavage. During Collision-Induced Dissociation (CID), kinetic energy is converted into internal energy through collisions with inert gas molecules, facilitating the breakage of the amide bond. This specific cleavage generates b-ions, which retain the charge on the N-terminal fragment, and y-ions, where the charge remains on the C-terminal fragment. When interpreting mass spectrometry data for peptides, the presence of a continuous y-ion series is often the most definitive evidence for sequence accuracy.
A systematic mapping of these ions allows researchers to reconstruct the amino acid sequence from the C-terminus to the N-terminus. Because y-ions are typically more stable and prominent in CID spectra, they form the backbone of most manual and automated de novo sequencing efforts. This stability is largely attributed to the presence of basic residues at the C-terminus, which effectively sequester the charge during the fragmentation process.
The Mechanism of Backbone Cleavage
Peptide fragmentation is governed by the “mobile proton” model. In this framework, protons migrate from the N-terminus or basic side chains to various positions along the amide backbone, inducing bond weakening at the site of protonation. While the cleavage of different bonds can produce a, b, and c ions (N-terminal) or x, y, and z ions (C-terminal), CID predominantly yields b and y ion pairs. It’s observed that the cleavage of the C-N amide bond is the most energetically favorable path under standard collision energies. The resulting spectra display a series of peaks where the mass difference between adjacent ions corresponds directly to the mass of a specific amino acid residue.
Sequence Mapping and Amino Acid Mass Shifts
Successful sequence verification depends on calculating the mass difference between successive peaks in an ion series. Each gap represents the residue mass of an amino acid. For example, a mass shift of 71.04 Da indicates the presence of Alanine, whereas a shift of 113.08 Da suggests either Leucine or Isoleucine. Because these residues are isobaric, they cannot be distinguished by standard mass spectrometry alone. Researchers must also account for characteristic neutral losses that can complicate the spectrum. Common artifacts include:
- Water Loss (18.01 Da): Frequently observed from fragments containing Serine, Threonine, or Glutamic Acid residues.
- Ammonia Loss (17.03 Da): Typical for fragments containing Lysine, Arginine, or Glutamine.
- Internal Fragments: Ions that have undergone two cleavage events, often appearing as “double-hit” peaks that don’t belong to the primary b or y series.
Identifying these shifts is a critical component of interpreting mass spectrometry data for peptides. By filtering out neutral losses and focusing on the primary y-ion series, the sequence order can be verified with high-stakes precision, ensuring the chemical integrity of synthetic batches used in research.
Practical Workflow for Sequence Verification
Verifying a single synthetic research peptide requires a targeted methodology distinct from the broad discovery workflows used in proteomics. While automated search engines are efficient for complex mixtures, manual interpreting mass spectrometry data for peptides remains the definitive standard for ensuring laboratory precision. The following five-step sequence provides a rigorous framework for primary structure validation.
The process begins with the determination of the theoretical monoisotopic mass. Once established, researchers must locate the corresponding precursor ion in the MS1 spectrum. Verification of the charge state is essential at this stage to confirm that the observed m/z aligns with the expected molecular weight. After isolating the precursor, the MS2 fragmentation spectrum is analyzed. A complete y-ion series is sought to map the amino acid sequence from the C-terminus. Each observed mass shift between adjacent peaks is cross-referenced against standard amino acid residual masses. Final validation is achieved by documenting the percentage of sequence coverage; a high-confidence verification typically requires the identification of at least 80% of the possible backbone cleavages.
Utilizing Bioinformatic Tools for Prediction
Manual interpretation is supported by in silico fragment prediction. Tools such as ProtParam or MS-Product are utilized to generate theoretical fragment lists, providing a benchmark for experimental comparison. These tools allow researchers to visualize predicted b and y ion series before analyzing raw data. This predictive approach is a vital component of a How to buy research peptides strategy, where verified MS data serves as the primary metric for quality assurance. Comparing experimental results to these predicted spectra ensures that any deviations are identified prior to the commencement of research protocols.
Handling Post-Translational Modifications (PTMs)
Synthetic peptides often incorporate specific modifications to enhance stability or mimic biological states. Modifications such as phosphorylation (+79.97 Da), acetylation (+42.01 Da), or C-terminal amidation (-0.98 Da) result in predictable mass increases or decreases. Interpreting these shifts requires attention to neutral losses; for instance, phosphorylated residues often exhibit a characteristic loss of phosphoric acid (98 Da) during CID. Verification of C-terminal amidation is particularly critical in synthetic research, as it prevents unwanted degradation and alters the peptide’s electrostatic profile. Researchers should utilize these metrics to ensure that their Cognitive Function Research or metabolic studies are conducted with chemically accurate compounds. It’s essential that every modification is accounted for in the theoretical mass calculation to avoid false-negative results during sequence mapping.
Validating Purity and Identifying Impurities
Purity validation is the final safeguard in the synthesis workflow. It requires distinguishing between the target molecule and synthesis-induced artifacts with absolute precision. The methodology of interpreting mass spectrometry data for peptides extends beyond sequence mapping to the identification of trace contaminants that can compromise research outcomes. High-Performance Liquid Chromatography (HPLC) coupled with MS provides a dual-layer verification by correlating retention time with mass purity, ensuring that the detected ions originate from the primary peak of interest.
Common Synthesis Byproducts
Deletion sequences represent a common failure mode in solid-phase peptide synthesis (SPPS). These occur when an amino acid fails to couple during a specific cycle, resulting in a truncated sequence with an m/z signature exactly one residue mass lower than the target. For instance, a missing Leucine residue results in a mass shift of -113.08 Da. These impurities often elute close to the target peptide, making mass-specific detection essential.
Incomplete deprotection is another critical metric. Residual protecting groups like Trityl (Trt) or 2,2,4,6,7-pentamethyldihydrobenzofuran-5-sulfonyl (Pbf) manifest as significant mass increases in the MS spectrum. A Pbf group adds 252.1 Da to the expected mass. Oxidation products, specifically Methionine sulfoxide, are identified by a characteristic +15.99 Da shift. Researchers must distinguish these actual impurities from electrospray artifacts, such as dimer formation or solvent adducts, which don’t reflect the chemical integrity of the solid sample. Identifying these shifts is a core requirement when interpreting mass spectrometry data for peptides to ensure batch-to-batch consistency.
EuroLab Standards for Analytical Rigor
The EuroLab Peptides multi-level quality protocol mandates that every batch undergoes stringent internal and third-party validation. This protocol ensures that the Certificate of Analysis (COA) reflects the objective data required for high-stakes research. For professional applications, a COA must provide both the HPLC chromatogram and the MS spectrum to verify that the purity exceeds 98%. This transparency allows researchers to verify that the sample is free from truncated sequences or residual reagents.
Final verification involves correlating experimental data for specific compounds, such as BPC-157 or Ipamorelin, with established theoretical standards. The absence of deletion peaks and the alignment of the isotopic envelope with theoretical models provide the empirical proof of synthesis excellence. This meticulous approach to data transparency supports the rigorous demands of the specialized scientific community, positioning these products as elite tools for Tissue Repair & Recovery Research and other professional inquiry.
Advancing Analytical Standards in Peptide Research
Mastering the methodology for interpreting mass spectrometry data for peptides ensures that laboratory results are grounded in empirical evidence rather than algorithmic assumptions. By systematically mapping y-ion series and distinguishing between monoisotopic and average mass distributions, researchers can verify primary structures with absolute precision. This technical rigor is essential for identifying subtle synthesis errors, such as deletion sequences or residual protecting groups, that standard HPLC alone might overlook. It’s the difference between probable identity and verified chemical excellence.
Reliable research outcomes depend on the chemical integrity of the starting materials. Every batch we provide undergoes rigorous third-party lab testing, featuring high-resolution HPLC and MS/MS validation to confirm identity and purity. These products are intended strictly for in-vitro research use, ensuring that your data remains consistent and reproducible across all experimental protocols. We invite you to view our high-purity research peptides with verified COA data to support your next phase of professional inquiry. Your commitment to analytical excellence ensures the continued advancement of biochemical science.
Frequently Asked Questions
What is the difference between monoisotopic and average mass in peptide MS?
Monoisotopic mass is the sum of the masses of the most abundant isotopes for each element, such as Carbon-12 and Nitrogen-14. It’s the standard metric for peptides under 3000 Da because it provides a single, precise peak for identification. Average mass is the weighted mean of all naturally occurring isotopes. In larger molecules or low-resolution spectra, the isotopic peaks merge, necessitating the use of average mass for molecular weight assignment.
How do I identify a b-ion versus a y-ion in a tandem mass spectrum?
b-ions are N-terminal fragments that retain the charge at the amino terminus, while y-ions are C-terminal fragments with the charge at the carboxyl terminus. In Collision-Induced Dissociation (CID) spectra, y-ions are typically more intense due to the presence of basic residues like Arginine or Lysine at the C-terminus. Identification is achieved by calculating mass shifts starting from the respective ends of the theoretical peptide sequence.
Why does my peptide spectrum show multiple peaks for the same molecule?
This observation is primarily caused by the natural isotopic distribution of elements and the presence of multiple charge states. Every peptide generates an isotopic envelope where the peaks are separated by the mass of a neutron. Additionally, Electrospray Ionization often produces multiple protonation states, such as [M+2H]2+ and [M+3H]3+, which appear at different m/z values despite originating from the same intact molecule.
Can mass spectrometry differentiate between Leucine and Isoleucine?
Standard mass spectrometry cannot distinguish between Leucine and Isoleucine because they are isobaric isomers with an identical mass of 113.08 Da. Both residues yield the same mass shifts in b and y ion series. Differentiation requires specialized fragmentation methods, such as high-energy collision-induced dissociation (HE-CID) or electron-transfer dissociation (ETD), which can generate side-chain specific w-ions.
What are the most common impurities found in synthetic research peptides?
The most frequent impurities are deletion sequences and incomplete deprotection products. Deletion sequences occur when an amino acid coupling cycle fails, resulting in a mass loss equivalent to one residue. Incomplete deprotection leaves protecting groups like Pbf (+252.1 Da) or Trt (+242.1 Da) covalently attached. Oxidation of Methionine residues, resulting in a +15.99 Da shift, is also a common artifact in synthetic batches.
How much mass shift does a C-terminal amidation cause?
C-terminal amidation results in a mass decrease of 0.98 Da compared to the carboxylic acid form. This shift occurs because the terminal hydroxyl group (17.00 Da) is replaced by an amino group (16.02 Da). Accurate mass measurement is required to verify this modification; it’s a critical specification for many research peptides to ensure biological stability and correct electrostatic properties.
What is the significance of the signal-to-noise ratio in peptide verification?
The signal-to-noise (S/N) ratio serves as a fundamental metric for interpreting mass spectrometry data for peptides by defining the reliability of peak assignments. A high S/N ratio ensures that fragment ions are distinguishable from background electronic noise or solvent clusters. This is particularly important when identifying low-abundance impurities or verifying the complete y-ion series for sequence validation.
How do I determine the charge state of a peptide from the isotopic distribution?
Determining the charge state (z) is a prerequisite for interpreting mass spectrometry data for peptides and calculating true molecular mass. The relationship follows the formula z = 1 / Δ(m/z), where Δ(m/z) is the distance between adjacent isotopic peaks. If the peaks are separated by 1.003 Da, the charge is +1. A spacing of 0.5 Da indicates a +2 charge, while 0.33 Da signifies a +3 charge. This spacing is a non-negotiable benchmark for raw data validation.
