
A dominant peak is evidence about a method, not proof of peptide identity or absolute purity. For researchers focused on understanding HPLC chromatograms for peptides, that distinction matters: retention time and peak area can look definitive, but each reflects how a sample behaved under specific chromatographic conditions. A single prominent peak may still conceal co-eluting compounds or components the detector does not register.
It is useful to start with the largest peak, its retention time, and the baseline. These features help assess the separation, but they need context before they can support conclusions about a sample. Chromatograms generated with different columns, gradients, mobile phases, or detector settings cannot be compared by appearance alone.
This guide explains how to interpret retention time, peak area, and baseline behavior; what a UV chromatogram can and cannot establish; and which supporting evidence, such as batch-specific mass spectrometry data and analytical method details, to review. The goal is a disciplined interpretation of supplier-provided documentation for in-vitro research, not treating one trace as a standalone quality verdict.
Key Takeaways
- Use retention time, detector response, and peak area to describe what the chromatogram shows, not to identify a peptide by appearance alone.
- Understanding HPLC chromatograms for peptides includes recognizing that method conditions can change separation and reported purity percentages.
- Check the report’s sample identification, analytical method, detector, peak integration, analysis date, and laboratory attribution before drawing conclusions.
- Consider what the chromatogram may not detect, and review complementary analytical evidence when assessing identity or sample characteristics.
- Treat supplier-provided analytical documentation as evidence to evaluate, not a guarantee of reproducibility or experimental performance.
What a Peptide HPLC Chromatogram Shows, and What It Does Not
A peptide HPLC chromatogram records detector response as sample components pass through a chromatographic system. In High-performance liquid chromatography (HPLC), components may separate because they interact differently with the column and mobile phase. The trace shows signals observed under a particular method; it does not, by itself, identify every signal or reveal every substance in the sample.
That distinction is central to understanding HPLC chromatograms for peptides. A chromatogram provides evidence about separation and detector response. Interpreting it requires the method details, detector type, and any other relevant analytical results.
What do the axes, baseline, and peaks represent?
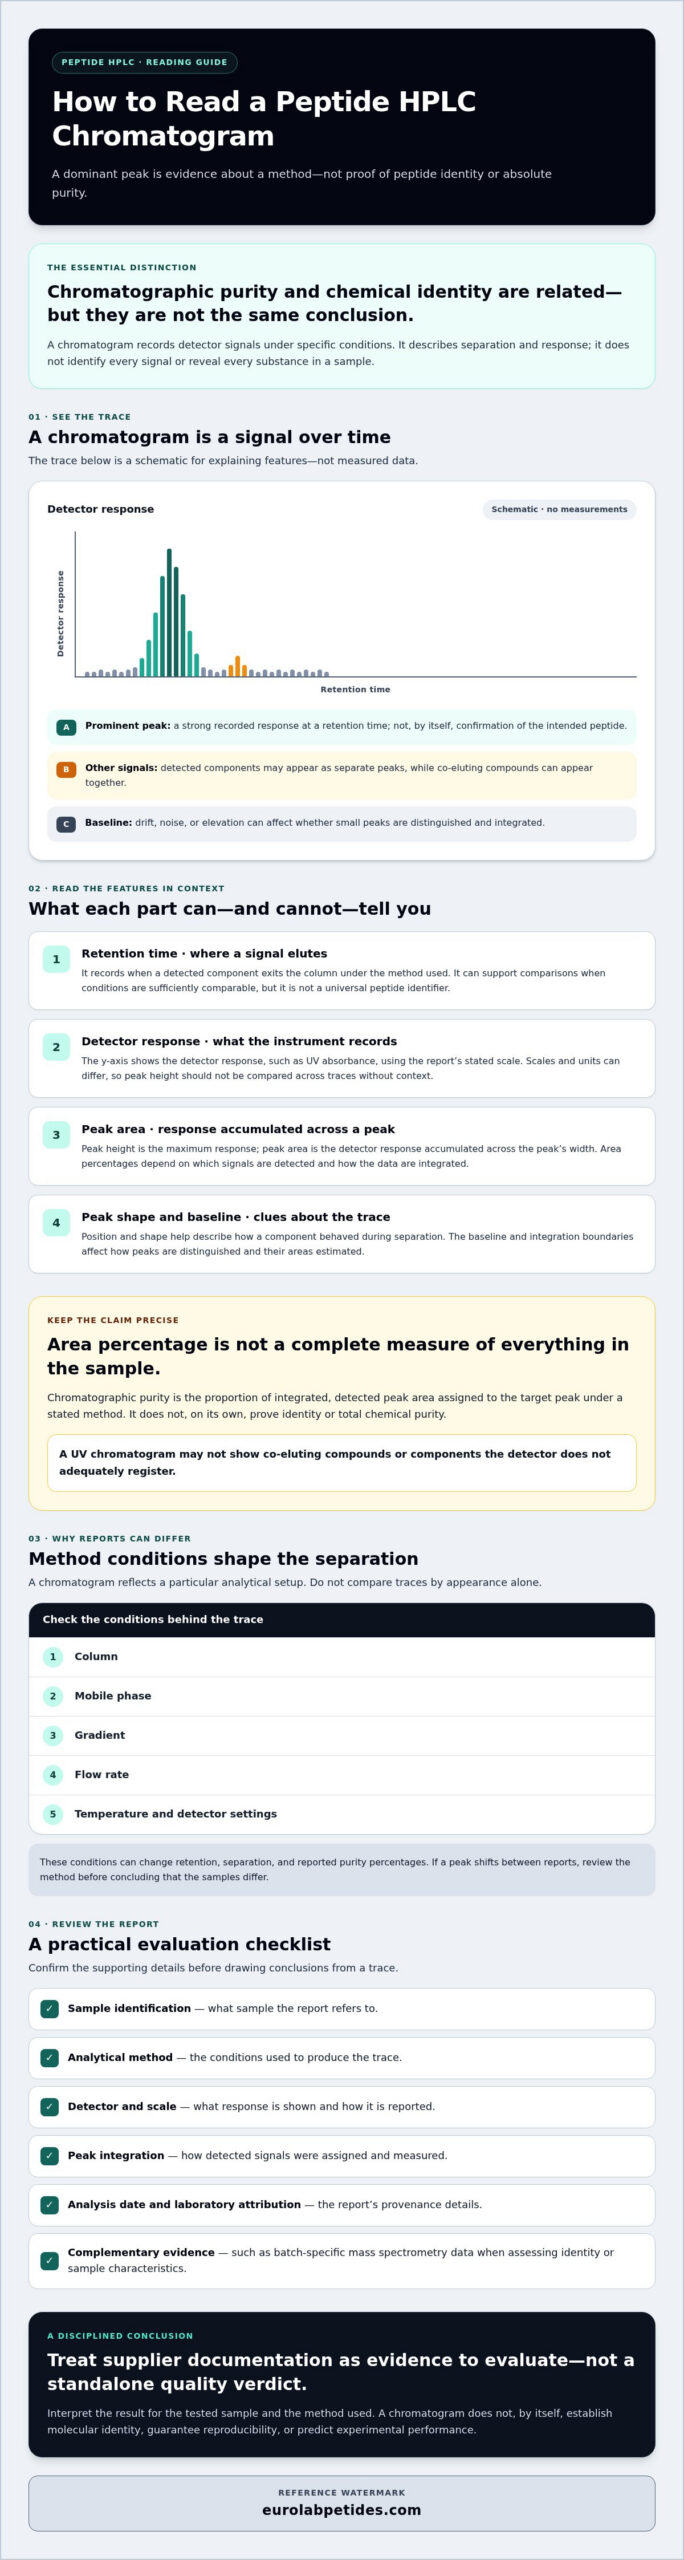
The x-axis usually shows retention time, the time elapsed before a detected component exits the column and produces a signal. Retention time depends on analytical conditions, including the column, mobile phase, gradient, flow rate, and temperature. It is not a universal identifier for a peptide.
The y-axis shows detector response, such as UV absorbance, using the scale specified in the report. Scales and units can differ between instruments and analyses, so peak height should not be compared across traces without context. The baseline is the detector signal when no distinct analyte peak is being recorded. Baseline drift, noise, or elevation can affect whether small peaks are distinguished and integrated.
Each peak represents a detected signal over time. Its position and shape can help assess how a component behaved during separation, while its integrated area estimates the signal across that peak. Neither feature establishes the compound’s identity without supporting evidence.
Does one large peak prove peptide identity or purity?
No. A prominent peak shows that the detector recorded a strong response at that retention time. It does not confirm that the peak is the intended peptide. Different compounds can co-elute and appear as one peak, while components that the detector does not adequately detect may not appear in the trace. Method selectivity matters too: a method that separates some impurities may not resolve others.
Chromatographic purity is the proportion of integrated, detected peak area assigned to the target peak under a stated method; chemical identity is evidence that the molecule has the intended structure. These are related but distinct conclusions. A high area percentage is not, on its own, proof of identity or total chemical purity.
Interpret the result as applying to the tested sample and the analytical method used. A chromatogram can be useful evidence in supplier documentation, but its meaning depends on the sample details and method conditions. It does not establish experimental performance.
How to Read Peptide HPLC Peaks, Retention Time, and Area
Inspect a chromatogram in a consistent order before interpreting its reported purity: confirm the axes and method details, note retention times and peak shapes, then review how the peaks were integrated. This helps prevent a visually dominant signal from being treated as a complete account of the sample. For understanding HPLC chromatograms for peptides, read each feature in relation to how the analysis was performed.
What can retention time tell you about a peptide sample?
Retention time records when a detected component elutes under the method used. It can help compare results when the analytical conditions are sufficiently comparable, but it cannot identify a peptide on its own. Column chemistry, mobile-phase composition, gradient, flow rate, and temperature can all affect retention. If a peak shifts between reports, check these conditions before deciding that the samples differ. A matching retention time is also supporting context, not confirmation of molecular identity.
How should peak area and peak integration be interpreted?
Peak height is the signal’s maximum response; peak area is the detector response accumulated across the peak’s width. A narrow, tall peak and a broader, shorter peak may have similar areas. Area is commonly used to calculate a peak’s proportion of the total integrated signal, but that percentage depends on which signals the method detects and how the data are processed.
“A chromatographic area percentage is method- and integration-dependent: it reflects detected and integrated signals under specified conditions, not an independent measure of every component in a sample.”
Integration software estimates where a peak begins and ends, often relative to the baseline. Baseline placement, peak splitting or grouping, and integration settings can change the area assigned to individual peaks and the total area used in a percentage calculation. When reviewing a report, check whether the integration boundaries look reasonable, particularly for small peaks, shoulders, or signals close together. If available, compare the trace with its peak table and method information.
Detector response also varies with the compound and the detection conditions. Compounds may not produce equal signals for equal amounts, and components with weak or absent response at the selected detector settings may be underrepresented or not appear. Area percentages therefore describe the distribution of signals captured by that method, not necessarily the mass fraction of every substance present.
For supplier-provided documentation, check whether the trace, integration, and analytical conditions are available for review. EuroLab Peptides describes in-house and independent third-party testing; researchers can assess any available documentation against their in-vitro research needs. Explore research-grade peptide information as a starting point for that review.
Why Peptide HPLC Purity Results Can Differ Between Methods
A reported purity percentage is tied to the method that produced it. Change the separation conditions, detection, or integration choices, and components may resolve differently, produce different signals, or be counted differently. Understanding HPLC chromatograms for peptides means comparing the analytical context, not just the percentages printed on separate reports.
Which method conditions can change a chromatogram?
Reversed-phase HPLC is commonly used for peptide analysis, but the specific method should be verified in each report. Column chemistry influences how components interact with the stationary phase. Mobile-phase composition and gradient affect how they elute, while flow and temperature can also alter retention and resolution. Detector settings shape which signals are recorded. Sample preparation and loading matter as well: an unsuitable solvent or excessive sample load can contribute to distorted peaks or reduced separation. The examples below describe possible effects, not recommended universal settings.
| Condition | Possible chromatogram effect | Interpretation caution |
|---|---|---|
| Column chemistry | Changes retention and selectivity between components. | Matching retention times across different columns may not mean equivalent separation. |
| Mobile phase and gradient | Shifts elution and can alter how closely peaks are resolved. | Compare solvent composition and gradient profile, not just reported peak positions. |
| Flow and temperature | Can affect retention and peak shape. | Differences may reflect conditions rather than a sample change. |
| Detector settings | Change the recorded response and visibility of components. | Area percentages describe signals captured under those settings. |
| Sample preparation and loading | May broaden, distort, or merge peaks and affect resolution. | Review preparation and loading details before attributing shape changes to composition. |
Purity values generated by unlike methods should not be treated as directly equivalent. For example, a difference in reported area percentage may result from changed selectivity, detection, or integration, even when the samples are similar. A fair comparison requires sufficiently comparable conditions and clear documentation of how the results were generated.
When is HPLC evidence not enough on its own?
Chromatographic separation shows how detected components behave under a method; it does not independently establish molecular mass or amino-acid sequence. Two compounds may co-elute, and components outside the detector’s effective response may not be represented. A single resolved peak therefore cannot answer every question about identity or composition.
Liquid chromatography-mass spectrometry (LC-MS) can provide orthogonal evidence by pairing separation with mass-based analysis. It can strengthen an assessment, but it does not automatically resolve every structural question or replace review of method suitability. Examine the chromatogram alongside the method description, sample details, detector information, and any complementary analytical results. Conclusions should reflect the evidence actually reported, not an assumed equivalence between different test methods.
A Practical Checklist for Evaluating a Peptide HPLC Report
A chromatogram is most useful when it can be connected to the material tested and the procedure used. Use this checklist to assess what the report supports, what remains uncertain, and which details may warrant a follow-up question. A missing detail is not proof that a test failed; it limits what you can conclude from the document alone.
What details should an analytical report include?
Review the report in sequence. This keeps the sample, method, and result connected instead of treating a purity figure as a standalone verdict.
- 1. Confirm the sample or lot. Look for a sample name, batch or lot identifier, and enough information to connect the result to the material under review. If that link is unclear, ask whether the displayed chromatogram represents the relevant sample or batch.
- 2. Read the method description. Check for the method details provided, such as the column, mobile phase, and gradient. These help explain how separation occurred and whether a comparison with another result is meaningful.
- 3. Identify the detector. The detector and its settings shape which components produce visible signals. Confirm what produced the trace before interpreting the peak distribution.
- 4. Review the chromatogram and integration. Check whether peaks are labelled or listed, and whether the report explains integration or the calculation of area percentages. Look for stated limitations that affect interpretation.
- 5. Check the analysis date and laboratory attribution. Note when the analysis was performed and which laboratory is identified, if reported. These details provide context for evaluating the document; they do not, by themselves, establish analytical quality.
- 6. Look for complementary results. If your research requires evidence of molecular identity, check whether additional testing, such as mass spectrometry, is reported and what conclusion it supports.
What questions should you ask when documentation is incomplete?
Ask targeted questions rather than assuming the report is invalid. For example: “Which method and detector produced this chromatogram?” “Does this trace correspond to the batch or sample identified here?” “How were the peaks integrated, and how was the reported percentage calculated?” If identity evidence is relevant to your work, ask what complementary testing was performed and request the corresponding result where available.
These checks support a disciplined understanding of HPLC chromatograms for peptides, especially when reviewing supplier-provided analytical documentation. EuroLab Peptides describes in-house and independent third-party testing; researchers should assess the available report details in light of their in-vitro research needs. For broader sourcing and documentation context, see How to Buy Research Peptides: A 2026 Guide to Purity, Sourcing, and Laboratory Standards.
To review research-grade peptide options and available documentation, visit EuroLab Peptides research information.
Using HPLC Evidence Responsibly When Selecting Research Peptides
An HPLC report is one part of a supplier assessment, not a complete prediction of how a material will behave in an experiment. Use the chromatogram to evaluate the sample characteristics it measures, then consider whether the documentation is traceable and transparent enough for your research question. Understanding HPLC chromatograms for peptides means weighing the evidence without extending its conclusions beyond the method and sample tested.
How should chromatograms fit into a supplier assessment?
Review the trace alongside its sample or batch identifier, method description, detector information, and any complementary analytical results. Together, these details help establish what was tested and what the reported analysis can support. A single purity figure, even when clearly presented, cannot answer every question about identity, composition, or suitability for a particular laboratory procedure.
Assess the documentation as a whole:
- Trace readability: Can you inspect the chromatogram and understand the reported peaks and integration?
- Report traceability: Is the result clearly connected to the relevant sample or batch?
- Method transparency: Are enough analytical conditions stated to interpret the separation and its limitations?
- Complementary evidence: Are other analytical results available when your research context calls for them?
These checks support a reasoned assessment, not a guarantee of reproducibility. Experimental outcomes also depend on research design, handling, and other conditions beyond what a chromatogram establishes. For foundational context on peptide terminology and research, consult What Are Peptides? A Comprehensive Guide for Researchers.
What can EuroLab Peptides’ testing information establish?
EuroLab Peptides describes a multi-level quality-control process that includes in-house and independent third-party laboratory testing. That description provides context for evaluating its analytical documentation, but it does not establish a particular method, detector setting, purity threshold, certification, or result for an individual batch. Confirm those details in the relevant report rather than assuming them.
For peptides supplied for in-vitro research and laboratory development, use available documentation to assess whether the reported evidence fits the needs of the intended laboratory work. If a method or result is unclear, request clarification. Transparent records allow researchers to scrutinize the evidence, while independent scientific assessment remains their responsibility.
Review EuroLab Peptides’ research-grade peptide information and available analytical documentation to evaluate the information relevant to your research needs.
Make Each Chromatogram Part of a Wider Evidence Review
Understanding HPLC chromatograms for peptides means reading the trace in context. Retention time depends on the method, while peak area reflects detected signals and their integration. A dominant peak can support an assessment of chromatographic purity, but it does not independently confirm molecular identity or establish every characteristic of a sample.
Before drawing conclusions, check that the report identifies the tested sample, describes the analytical method and detector, and presents results suited to your research question. Where identity evidence is needed, review complementary analytical information. Treat results from different methods cautiously, and do not interpret analytical data as a guarantee of reproducibility or experimental performance.
EuroLab Peptides describes in-house and independent third-party laboratory testing. Its products are designated for in-vitro research and laboratory development. Review the available documentation directly to determine what the reported evidence establishes and what questions remain.
Review EuroLab Peptides’ research-grade peptide information and assess the documentation against your research requirements. A careful, evidence-led review supports informed laboratory decisions.
Frequently Asked Questions
What does a peptide HPLC chromatogram show?
A peptide HPLC chromatogram shows detector response as components in a sample elute from a chromatographic column. Retention time is generally plotted on the x-axis, and detector response on the y-axis. Peaks represent detected signals under the method used. The trace can help assess separation and relative peak areas, but interpretation depends on the sample, analytical conditions, detector, and data processing.
Does a single main peak mean a peptide is pure?
No. A single dominant peak indicates that one signal accounts for most of the detected response under the method, not that the sample contains only one compound. Components may co-elute, and substances that the detector does not register may be absent from the trace. Treat the peak as evidence about the tested sample and method, not as standalone proof of identity or absolute purity.
What does peak area percentage mean in HPLC?
Peak area percentage is the integrated area assigned to a peak divided by the total integrated area of the peaks included in the calculation. It describes the relative detector response captured by that analysis. It is not automatically the sample’s mass percentage: detector response can vary among compounds, and integration choices affect the result. Check the detector, integration, and calculation details when reviewing a reported value.
Can retention time confirm peptide identity?
No. Retention time tells you when a detected component eluted under specific analytical conditions. Column chemistry, mobile phase, gradient, flow, and temperature can affect it, so retention time can support comparisons only when methods are sufficiently comparable. A matching time alone does not establish molecular identity. Researchers should review complementary identity evidence, such as mass spectrometry data, when relevant to the analysis.
Why do HPLC purity results differ between laboratories?
Results can differ because laboratories may use different columns, mobile phases, gradients, detector settings, sample preparation, or integration rules. These choices can change separation, signal response, and the area assigned to peaks. A reported percentage therefore reflects both the sample and the method used to analyze it. Compare method details before interpreting different values as evidence that the samples themselves differ.
Is HPLC enough to verify a research peptide?
HPLC provides useful evidence about chromatographic separation and detected signals, but it may not establish molecular mass or sequence. Co-elution and detector blind spots can also limit what the chromatogram reveals. LC-MS can provide complementary evidence, although no single analysis answers every question. Understanding HPLC chromatograms for peptides means considering the trace alongside method details and other results relevant to the research question.
What information should I look for on a peptide HPLC report?
Look for a sample or lot identifier that connects the report to the material, the analysis date, laboratory attribution where reported, and a method description. Check the detector, chromatogram, peak table, integration, and explanation of any calculated percentages. If details are missing, ask which method produced the trace, whether it represents the relevant sample, and whether complementary identity testing is available when your research requires it.
