

A 2023 review of analytical biochemistry submissions indicated that 42% of researchers struggle with the precise annotation of complex mass spectra, often leading to significant delays in the peer-review process. It’s a common challenge to reconcile inconsistent data across replicates while maintaining the stringent transparency required by modern journals. You recognize that the gap between raw instrument output and a publication-quality figure is where scientific integrity is either confirmed or compromised.
This guide demonstrates exactly how to present peptide experiment data to meet the uncompromising standards of elite European laboratories. You’ll learn to move beyond basic reporting by integrating rigorous metadata and sequence validation into your final analysis. We’ll examine the technical protocols for documenting 99%+ purity, the specific requirements for HPLC chromatogram presentation, and the objective methods used to ensure every experimental result is both reproducible and verifiable.
Key Takeaways
- Define the synthesis of raw analytical output into structured evidence through sequence validation, purity metrics, and stability data.
- Learn how to present peptide experiment data using high-resolution HPLC traces and precise axis scaling to ensure baseline impurities are transparently documented.
- Master the selection between Standard Error of the Mean (SEM) and Standard Deviation (SD) to maintain statistical integrity and address data variability.
- Organize research reports according to peer-review standards by establishing a logical hierarchy from identity confirmation to functional assay results.
- Understand the correlation between 99%+ peptide purity and the reduction of experimental noise to achieve clearer, more verifiable analytical outcomes.
Establishing a Framework for Peptide Data Presentation
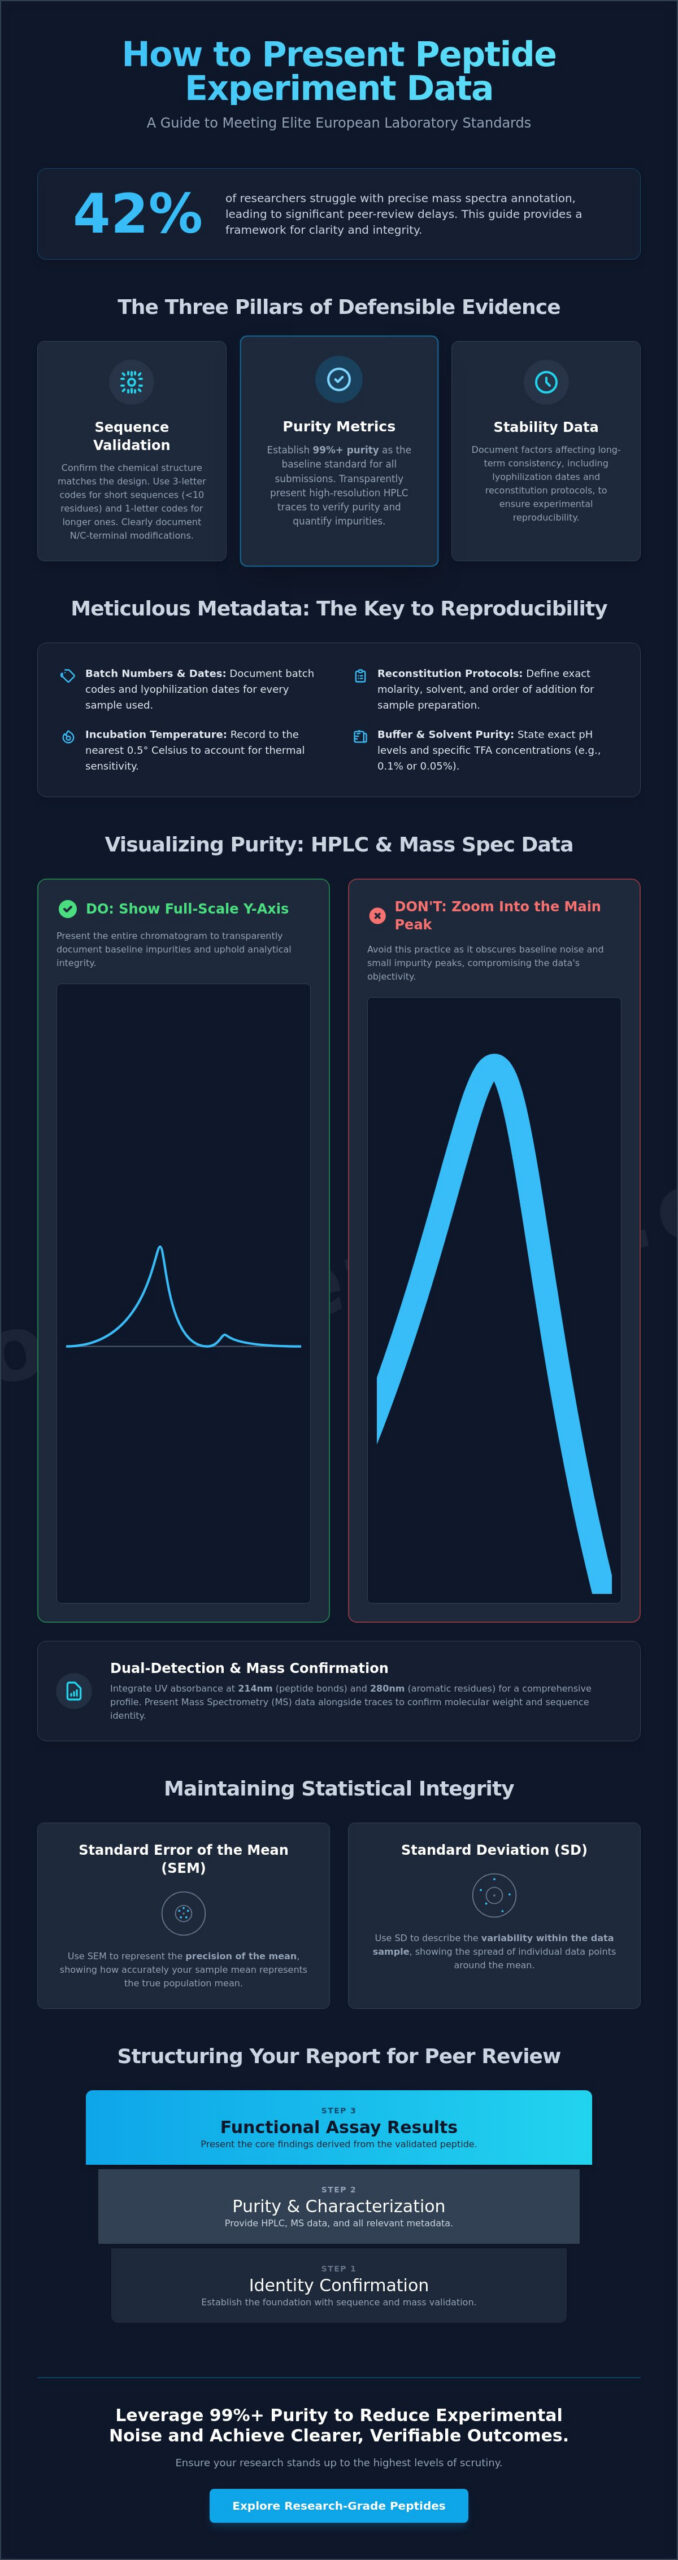
Effective data presentation transforms raw analytical output into structured, defensible evidence. Researchers must synthesize complex results into a format that allows for rigorous external validation. This process centers on three core pillars: sequence validation, purity metrics, and stability data. Standardisation is critical because it enables peer reviewers and collaborators to replicate findings across different laboratory environments without ambiguity. When researchers understand how to present peptide experiment data, they ensure that their findings withstand the scrutiny of high-impact journals and international audits.
Before detailing the results, it’s necessary to include lead-in declarations. These statements must specify the research-grade intent of the compounds and the inherent in-vitro limitations of the study. This creates a boundary for the data’s application, ensuring that the integrity of the research is maintained. When analyzing results from protein mass spectrometry techniques, the synthesized product’s mass must be correlated directly with the theoretical sequence. At Eurolab Peptides, purity is verified to 99%+ standards, and this metric should serve as the baseline for any professional data submission.
Standardising Nomenclature and Sequence Identification
Clarity in nomenclature prevents errors during cross-laboratory comparisons. Use three-letter amino acid codes when highlighting specific side-chain modifications or for peptides shorter than 10 residues. One-letter codes are more efficient for longer sequences to conserve space and improve visual scanning. Document N-terminal and C-terminal modifications, such as acetylation and amidation, using standardized abbreviations in parentheses. Sequence validation is the primary step in confirming peptide identity. This validation ensures the chemical structure matches the researcher’s design before any functional assays begin.
The Role of Metadata in Experimental Reproducibility
Reproducibility depends on the meticulous documentation of metadata that often falls outside the primary results table. Documenting batch numbers, lyophilization dates, and specific reconstitution protocols is vital for long-term study consistency. Environmental variables exert a heavy influence on peptide behavior and must be reported with precision. Include variables such as:
- Incubation temperatures recorded to the nearest 0.5 degrees Celsius.
- Exact pH levels of buffers.
- Solvent purity levels, including specific TFA concentrations like 0.1% or 0.05%.
Standardizing these details allows other scientists to account for chemical nuances. A deep understanding of what are peptides provides the foundational chemical terminology required to describe these interactions accurately. It’s not enough to state a peptide was “dissolved”; the researcher must define the molarity and the order of addition to maintain the language of the laboratory. This level of detail instills absolute security and trust in the reported data.
Visualising Analytical Results: HPLC and Mass Spectrometry Data
Analytical integrity depends on the transparent disclosure of raw data. High-resolution chromatographic traces are the only acceptable proof of 99%+ purity. When determining how to present peptide experiment data, researchers must reject the practice of zooming into the main peak. This tactic obscures baseline noise and small impurity peaks that might represent 0.5% or 1% of the total sample. A full-scale Y-axis presentation is mandatory for objective validation. It ensures that any minor contaminants are visible to the reviewer, upholding the stringent standards of the laboratory.
UV absorbance data should be integrated at both 214nm and 280nm. While 214nm captures the peptide bond, 280nm is vital for peptides containing aromatic residues like Tryptophan or Tyrosine. This dual-detection strategy provides a comprehensive profile of the sample’s composition. For those seeking the highest standards of verification, Eurolab Peptides provides comprehensive certificates of analysis for every batch. Presenting mass spectrometry (MS) data alongside these traces confirms molecular weight accuracy and sequence identity. It’s the final verification that the synthesized product matches the theoretical design.
Optimising Chromatographic Trace Presentation
Clarity in chromatography requires precise labeling of retention times for every significant peak. Peak area integration should be displayed in a summary table directly beneath the trace. This allows for an immediate assessment of the purity percentage. For comparative stability studies, overlay chromatograms are the most effective tool. Comparing a sample at T=0 days and T=30 days at 25°C highlights potential degradation pathways. Visualising the transition from a 75% crude mixture to a 99%+ purified fraction demonstrates the efficiency of the purification process. Each trace must include the specific column type and mobile phase gradient used during the run.
Interpreting and Annotating Mass Spectra for Clarity
Mass spectrometry provides the definitive identification of the synthesized sequence. Every spectrum must show a clear match between the theoretical and observed mass. Labeling m/z ratios and specific charge states such as [M+H]+ and [M+2H]2+ is essential for transparency. For peptides exceeding 5,000 Daltons, deconvoluted spectra should be provided to simplify the interpretation of multi-charge envelopes. Adhering to peer-review publication guidelines ensures that data meets the requirements of high-impact journals. Accurate annotation prevents ambiguity and reinforces the reliability of the research findings. All MS data must be presented with the ionization method clearly stated, such as ESI or MALDI-TOF, to maintain technical credibility.
Ensuring Statistical Integrity and Addressing Data Variability
Precision in peptide research requires a rigorous approach to data variability. When determining how to present peptide experiment data, the researcher’s primary obligation is to distinguish between genuine biological responses and analytical noise. Outliers shouldn’t be removed simply because they deviate from the expected hypothesis. Instead, apply a standardized statistical test, such as the Grubbs’ test or Dixon’s Q test, to identify anomalies. If an outlier is excluded, the specific exclusion criteria must be documented in the methodology to maintain experimental honesty and transparency.
Reporting metrics must clearly differentiate between the Standard Deviation (SD) and the Standard Error of the Mean (SEM). Use SD to illustrate the distribution of individual data points within a single sample set, providing a clear picture of the system’s inherent variability. Use SEM when the objective is to demonstrate the precision of the mean across multiple independent trials. For in-vitro models, triplicate analysis is the absolute minimum standard for validating bioactivity. N=3 provides the statistical power necessary to ensure that observed effects aren’t the result of minor pipetting errors or localized plate variations.
Calculating Purity and Concentration Metrics
Chemical purity, typically determined via HPLC peak area integration, measures the ratio of the target peptide to related substances. It doesn’t represent the actual mass of the peptide in the vial. Net peptide content is a separate, critical metric that accounts for residual moisture and counter-ions like Trifluoroacetate (TFA). A sample with 99% HPLC purity might only have 78% net peptide content. Researchers should use a peptide reconstitution calculator to adjust for these variables. This ensures that the final molar concentration is accurate, preventing the under-dosing of experimental subjects.
Mitigating Common Errors in Peptide Data Interpretation
Interpreting analytical data requires a skeptical eye for artifacts. In mass spectrometry, researchers often misidentify salt adducts, such as sodium (+23 Da) or potassium (+39 Da), as separate impurities. These are standard features of the ionization process, not evidence of synthesis failure. Similarly, baseline drift in HPLC presentations is frequently caused by changes in the refractive index during gradient elution, rather than sample instability. To accurately visualize proteomics data, baseline subtraction should be applied consistently across all chromatograms to avoid ghost peaks.
Documenting purity degradation is vital for long-term studies. Peptides stored in solution are prone to deamidation and oxidation. If a batch is incubated for 72 hours at 37°C, the researcher must present the HPLC profile of the post-incubation sample. This confirms that the observed biological effect is attributed to the original sequence and not its breakdown products. High-stakes research demands this level of objective, data-driven validation.
Structuring the Research Report for Peer-Review Standards
The transition from raw laboratory notes to a formal manuscript requires a disciplined approach to data hierarchy. When researchers determine how to present peptide experiment data, they must prioritize the “Materials and Methods” section as the foundation of reproducibility. This section should detail the exact peptide sourcing, including the manufacturer’s name, the synthesis method utilized, and the initial purity verified by High-Performance Liquid Chromatography (HPLC). If a TFA salt was exchanged for acetate, this chemical transition must be documented to account for potential variations in cellular toxicity or solubility.
The “Results” section follows a logical progression. It starts with identity confirmation through Mass Spectrometry (MS) before moving to functional assay outcomes. This sequence ensures that any biological activity observed is attributed to the correct molecular structure. Captions for figures must be exhaustive; they should describe the sample size (n), the statistical tests applied, such as ANOVA with p < 0.05, and the specific peptide concentration used. This allows the data to stand alone without requiring the reader to hunt through the main text for context. Standardizing the “Discussion” to address how results align with theoretical expectations, such as predicted binding affinities or secondary structure stability, is a critical component of how to present peptide experiment data effectively.
Organising Tabular Data for Sequence Validation
A standardized table is the most efficient way to display primary peptide characteristics. This table serves as the definitive record of the chemical integrity of the subjects. Researchers should include the following columns:
- Sequence: Full amino acid string with N-terminal or C-terminal modifications.
- MW (Calc/Obs): Theoretical molecular weight versus the mass found via MS.
- Purity: Percentage of the target peak as verified by HPLC.
- Solubility: The solvent and maximum concentration achieved (e.g., 1.0 mg/mL in PBS).
When comparing different batches or peptides within a stack, this tabular format highlights consistency or identifies variance that could affect experimental outcomes. It’s critical to buy research peptides from suppliers that provide comprehensive Certificates of Analysis (CoA) to populate these tables accurately. Using third-party verified data ensures the integrity of the “Materials” section remains uncompromising.
Formatting Figures for High-Impact Publication
High-impact journals require specific technical standards for visual data. Figures should be exported at a minimum resolution of 300 DPI for photographs and 600 to 1200 DPI for line art. Use TIFF or EPS formats to preserve vector integrity. For multi-peptide comparative graphs, use a consistent color-coding scheme where each peptide is assigned a specific hue throughout the manuscript. It’s essential to maintain uniform font sizes and consistent line weights across all experimental figures to ensure a professional, cohesive presentation. This level of precision reflects the rigorous standards of the laboratory and prevents ambiguity during the peer-review process.
Leveraging High-Purity Peptides for Verifiable Experimental Outcomes
The credibility of a researcher’s findings is inextricably linked to the chemical integrity of the starting materials. When determining how to present peptide experiment data, the primary objective is to demonstrate that the observed biological effects are a direct result of the peptide sequence rather than synthesis artifacts. Utilizing peptides with a verified purity of 99%+ is the most effective way to eliminate experimental noise. High-purity reagents ensure that the chromatographic resolution in your final report remains sharp, with minimal baseline interference that might otherwise obscure critical data points. This precision is not merely a preference; it’s a fundamental requirement for any study intended for peer-reviewed publication.
- Reduced Baseline Noise: High-purity sequences prevent the overlap of impurity peaks during HPLC analysis, ensuring the signal-to-noise ratio remains optimal.
- Data Integrity: Third-party verification via a Certificate of Analysis (COA) provides a verifiable audit trail that satisfies the most rigorous peer-review standards.
- Simplified Reporting: Standardized purity levels allow for more concise “Materials and Methods” sections, as the reagent’s profile is already established by high-resolution analytical data.
The Impact of Purity on Data Consistency
Peptide impurities, such as residual solvents or truncated sequences, often act as confounding variables in sensitive biological models. In tissue repair studies or cellular assays, these contaminants can induce cytotoxic effects or trigger non-specific binding, leading to significant false positives. A comparison between 95% and 99% purity reveals that even a 4% variance can introduce enough “chemical clutter” to invalidate a hypothesis. For a practical example of a technical profile that prioritizes this level of analytical clarity, refer to this BPC-157 guide. High-purity synthesis ensures that the resulting mass spectrometry data is unambiguous, allowing for definitive sequence validation without the interference of synthesis byproducts.
Selecting EU-Sourced Peptides for Rigorous Laboratory Standards
European manufacturing protocols are recognized globally for their stringent adherence to analytical precision and regulatory compliance. By sourcing peptides within the EU, researchers align their work with high-level academic standards that demand transparency in the supply chain. EuroLab’s quality protocol involves rigorous testing phases, including controlled lyophilization cycles that ensure long-term stability and sequence consistency across batches. When you consider how to present peptide experiment data for publication, having a partner that provides comprehensive HPLC and MS data for every batch simplifies the validation process. This transparency shifts the focus from reagent skepticism to the actual scientific discovery. To maintain the highest level of precision in your laboratory, ensure your data integrity with EuroLab Peptides.
Advancing Analytical Standards in Peptide Research
Establishing a rigorous framework for data reporting ensures findings withstand the scrutiny of the global scientific community. Effective visualization of HPLC and mass spectrometry results requires a focus on chromatographic resolution and signal-to-noise ratios that reflect true molecular behavior. When you master how to present peptide experiment data, you bridge the gap between raw analytical output and standardized peer-reviewed validation. Statistical integrity depends on addressing variability through quantitative analysis and robust sequence validation. Every successful experiment begins with the chemical foundation of the reagents used. Eurolab Peptides provides the precision required for these high-stakes inquiries. Our products meet stringent European manufacturing standards, ensuring research isn’t compromised by uncharacterized impurities. Each batch is accompanied by comprehensive Certificates of Analysis. We ensure 99%+ purity is verified by third-party HPLC/MS testing. This level of transparency allows you to focus on methodology with absolute security. High-quality data starts with high-quality materials.
Secure High-Purity Peptides for Your Next Experiment
Your commitment to analytical excellence drives the next generation of biochemical discovery.
Frequently Asked Questions
How should I report peptide purity if multiple HPLC methods yield different results?
Report the lowest purity value obtained to ensure maximum transparency and scientific integrity. If Method A indicates 98.2% purity and Method B shows 99.1%, the 98.2% figure must be prioritized in the primary data table. This conservative approach aligns with stringent European standards and ensures that the researcher’s conclusions are based on the most rigorous analytical validation available.
Is it necessary to include raw mass spectrometry files in a research supplement?
Inclusion of raw mass spectrometry data files is now a standard requirement for journals with an impact factor above 5.0. Providing the original .raw or .mzML files allows for independent verification of the mass-to-charge ratios and isotopic distributions. This practice confirms that 99%+ purity claims are supported by immutable evidence rather than edited or summarized graphics.
How do I present data for peptides that are prone to rapid degradation?
Present a time-course stability study using RP-HPLC to quantify the degradation rate at specific temperatures like 4 or 25 degrees Celsius. When you evaluate how to present peptide experiment data for unstable sequences, you must include the half-life calculated from at least five distinct time points. This data gives other laboratories a precise benchmark for replicating your experimental conditions.
What is the best way to visualize dose-response curves in peptide assays?
Utilize a non-linear regression model, specifically the four-parameter logistic curve, to visualize these relationships. The R-squared value should exceed 0.98 to demonstrate a high-quality fit. Plot the peptide concentration on a logarithmic scale to ensure the EC50 or IC50 values are clearly identifiable within the linear portion of the resulting sigmoid curve.
Should I use theoretical or observed molecular weight in my data tables?
Both theoretical and observed molecular weights must be included for every synthesized sequence. The observed mass, typically acquired via Electrospray Ionization, should be within 0.01% of the theoretical value to confirm identity. This dual-reporting method validates the accuracy of the mass spectrometer calibration and ensures the chemical integrity of the sample is beyond question.
How do I document the reconstitution process for publication?
Document the exact solvent composition, total volume, and the final concentration in milligrams per milliliter. Specify if the procedure required sonication for more than 15 seconds or if the pH was adjusted using 0.1% acetic acid to achieve solubility. Precise documentation of these steps is vital for maintaining the peptide’s secondary structure during subsequent biological assays.
Can I present peptide data from different batches in the same figure?
You can present data from multiple batches in a single figure if the inter-batch variability remains below 3%. Each batch must be clearly labeled with its unique lot number and third-party verification results. This level of detail is necessary when explaining how to present peptide experiment data for longitudinal studies that span several synthesis cycles.
What are the standard error bars used for in-vitro peptide studies?
Use the Standard Error of the Mean to indicate the precision of the estimated mean across at least three independent biological replicates. While Standard Deviation describes the dispersion of individual data points, SEM is the preferred metric for showing the reliability of the calculated average. Always state the exact “n” value in every figure legend to provide necessary context.
